Understanding and influencing user behaviour to increase activation rates by 12%
Growth
UX research

SmartCharge Programs (SCP) are how Geotab Energy teams up with utility companies across North America to reward EV drivers for charging at times that help the grid. To participate, drivers needed to sign up with eligible electric vehicles, receive the C2 device from Geotab and plug the device into their car. This device sent data about how and when they drove and charged, which we used to calculate their rewards.
Data showed that a lot of participants either weren’t installing the C2 device at all or were dropping out midway through the program. This was a problem, since utility companies were paying for the devices upfront but weren’t getting the data they needed for grid planning.
I stepped up to lead a research project to dig into a few key questions:
Why weren’t enrolled users installing their devices?
Why were some participants dropping out of the program?
And how could we improve both installation and participation rates?
To kick things off, I put together a research plan and timeline, then shared it with all the key stakeholders to make sure we were aligned on goals, milestones, and what to expect throughout the project.

Is this problem worth solving?
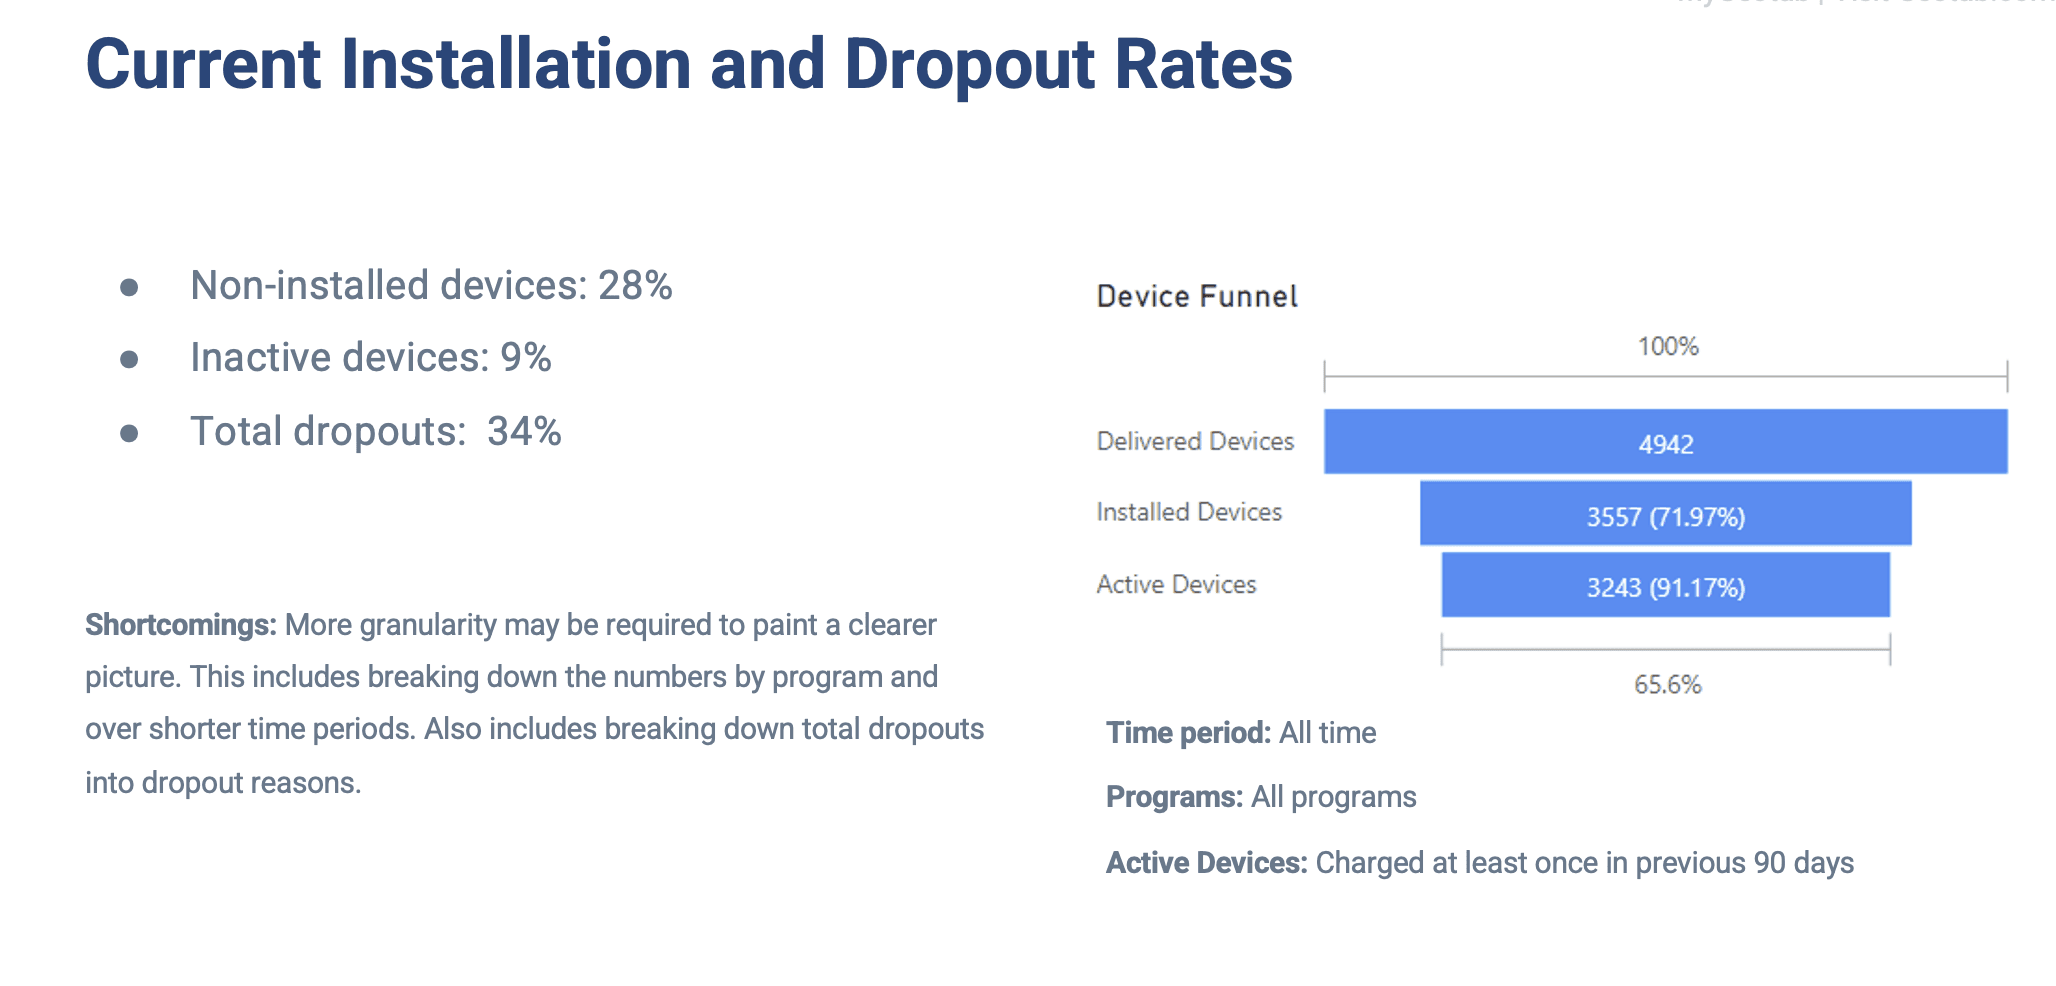
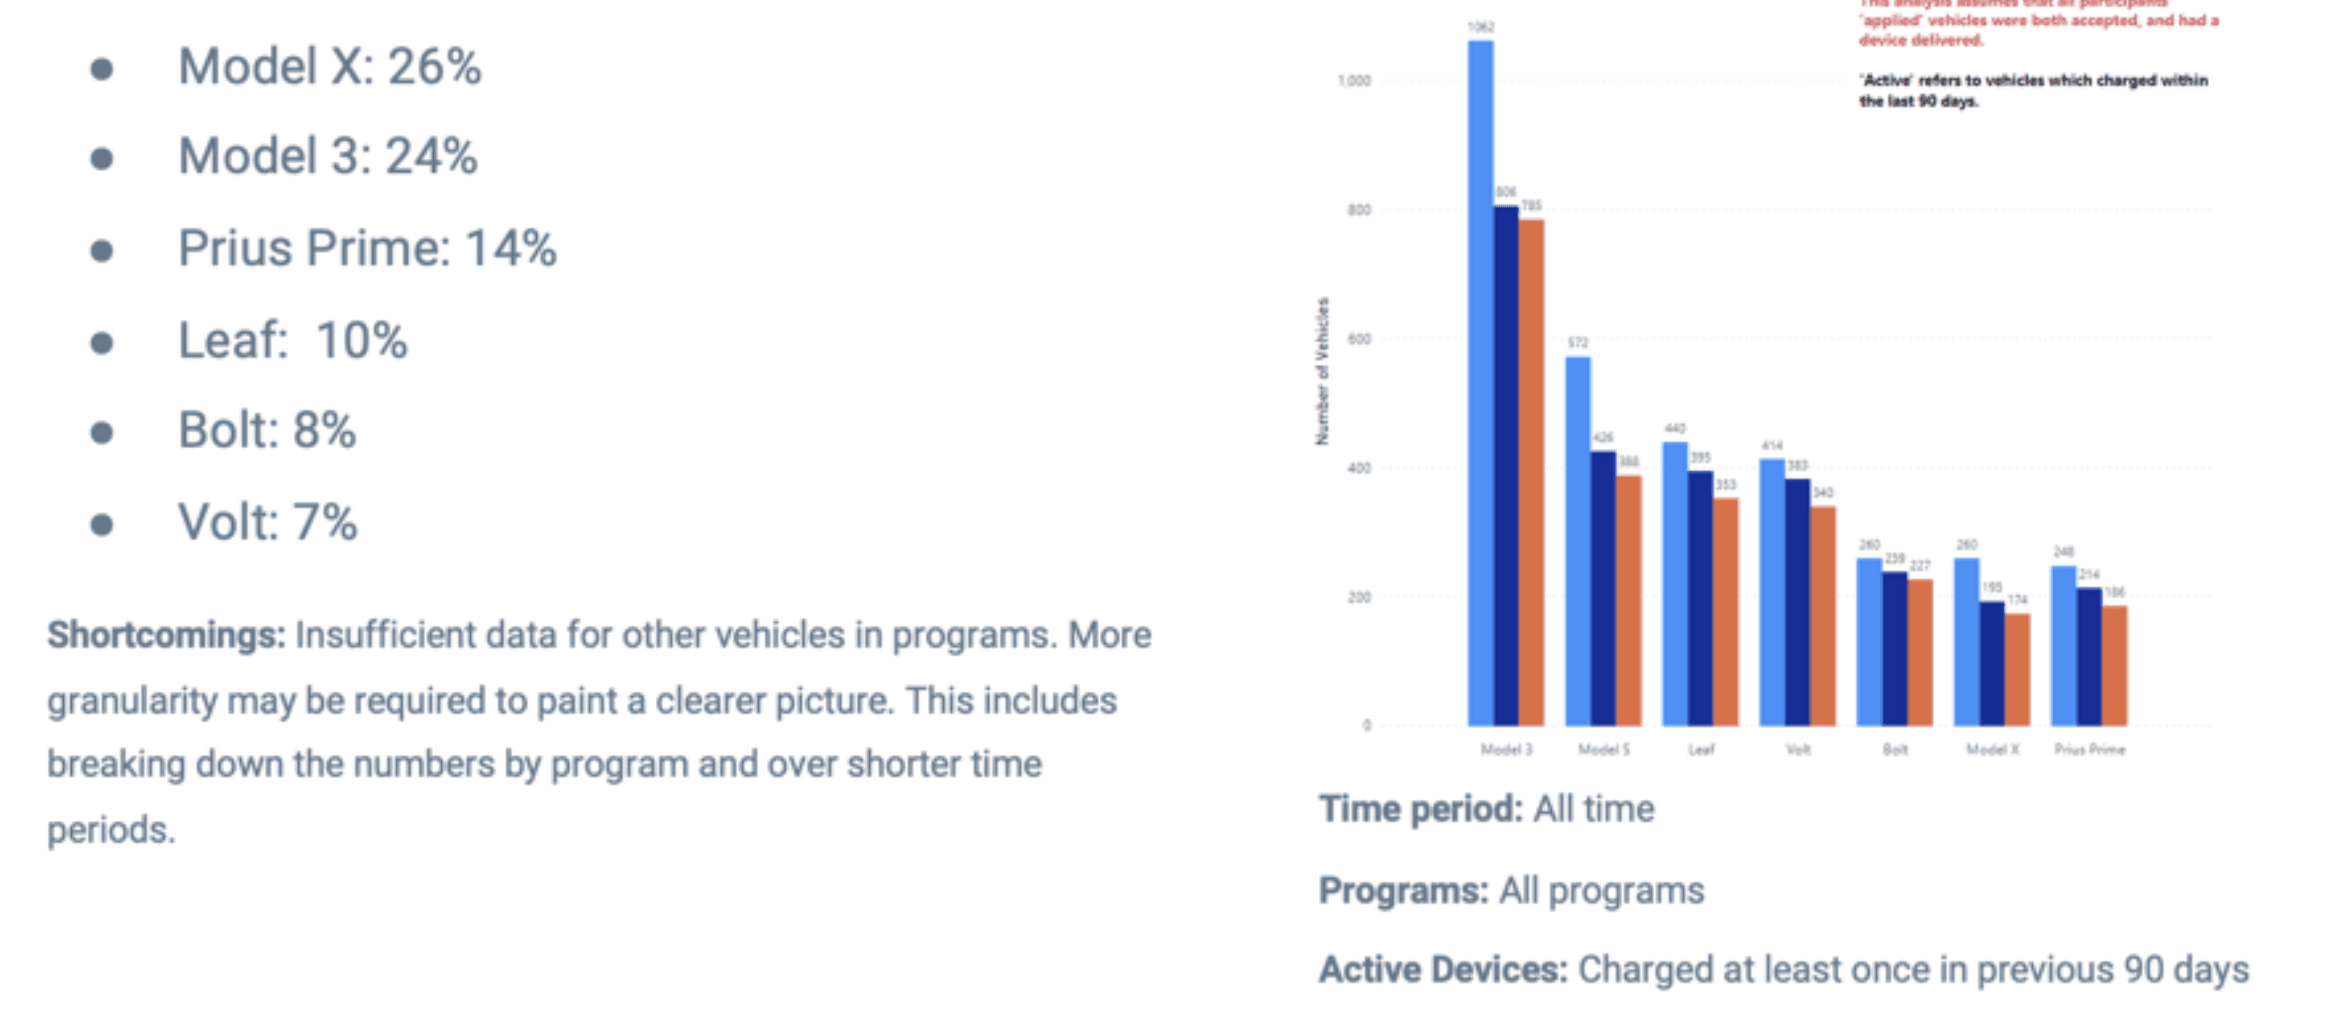
I pulled raw spreadsheet data from the program delivery team, crunched the numbers, and created a report showing just how big the problem was, looking at installation and drop-off rates across different EV types and models.
This confirmed the issue was worth solving and helped the team set realistic improvement goals. The data also pointed us to where we should focus our efforts: Teslas, which had the highest drop-off and non-installation rates.
What were the major reasons for drop-offs?
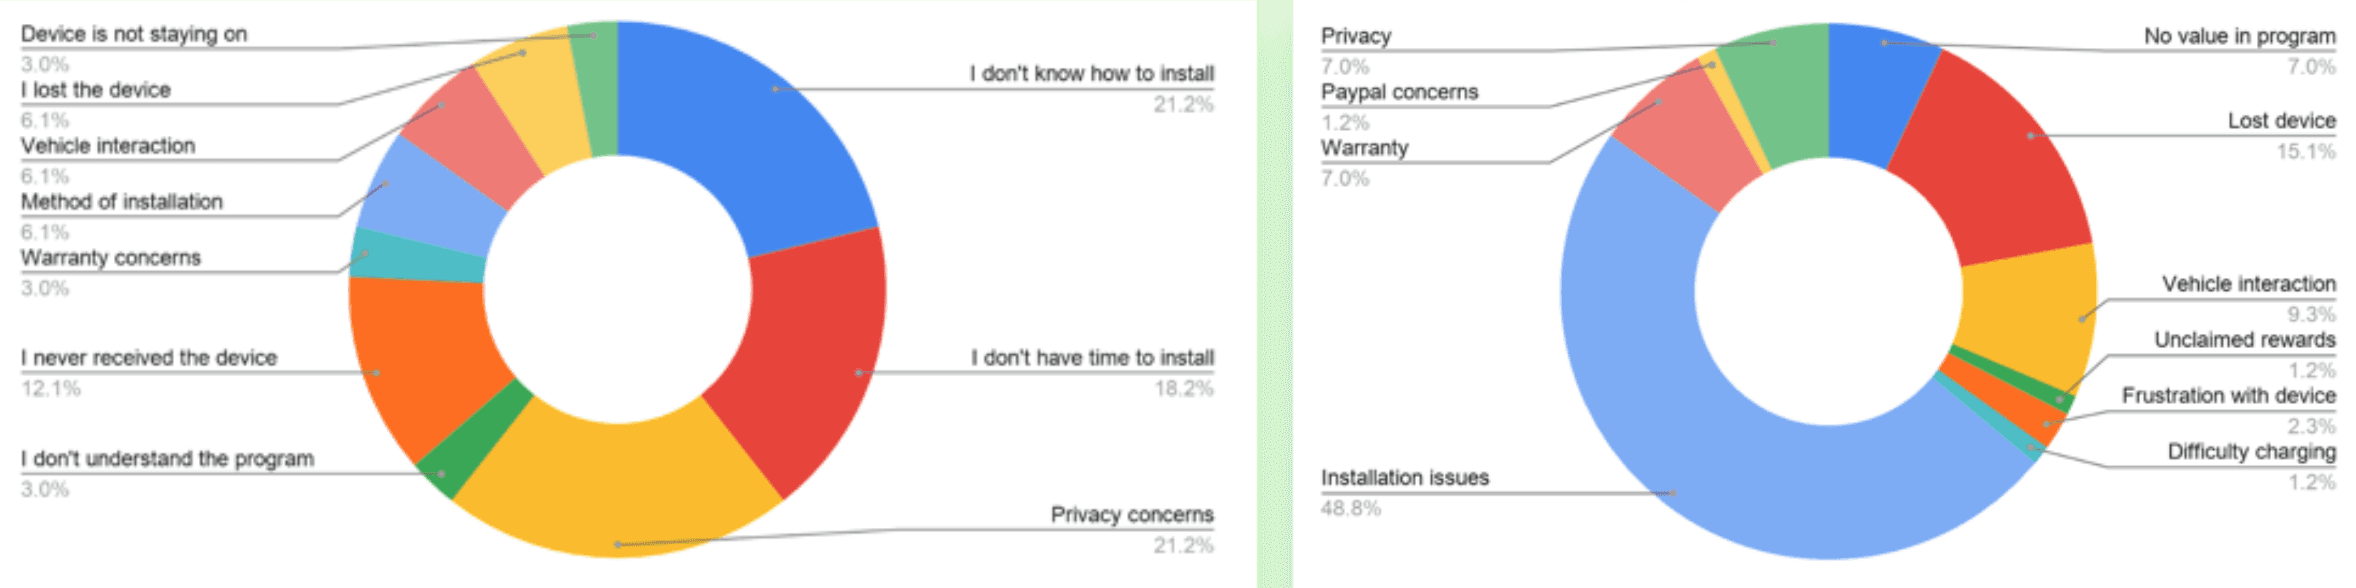
Once we understood the scope of the issue and narrowed our focus to Tesla models, I pulled user feedback from the customer support team and analyzed it to find the top reasons people gave for not installing their devices or dropping out early.
From there, we zeroed in on the key problem areas:
Not knowing how to install the device
Not having time to install it
The installation method itself
Privacy concerns
These became the main focus of our research going forward.
Seeing things from the user's perspective
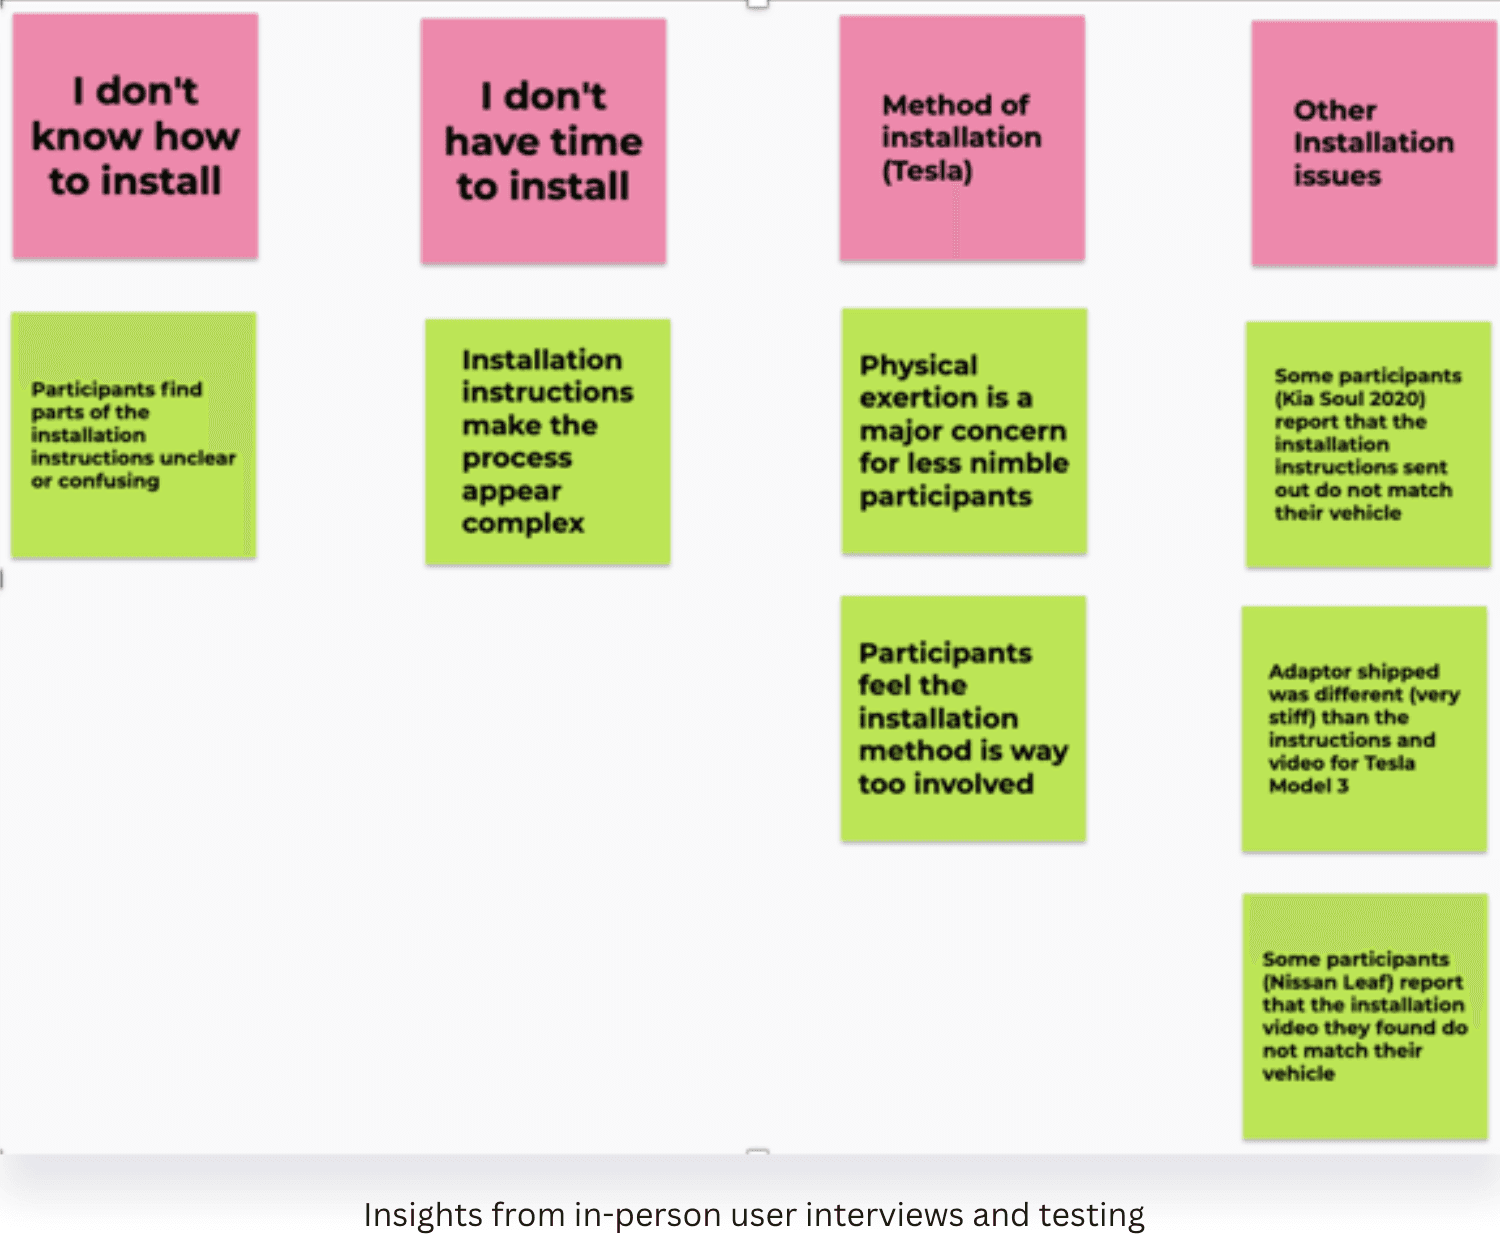
Since user feedback pointed to lack of time and knowledge as the top reasons for not installing the device, even though we thought the instructions were pretty clear, I set up in-person interviews and testing sessions. I wanted to watch users go through the installation process firsthand and spot any pain points or confusion.
One big insight that came out of this: the installation manual looked long and complicated, which made the whole process feel more time-consuming than it actually was. Many users overestimated how long it would take, which led to endless procrastination.
How might we improve the process?
With a clearer understanding of the pain points users faced during installation, I brought the team together for a brainstorming session to explore potential improvements. We mapped all the ideas on an Impact–Effort matrix to help us prioritize and identify the most actionable next steps.

Actionable next steps
With our recommendations in place, we outlined clear, actionable next steps for different team members and departments. These included:
Automated reminder emails: Send follow-up emails with attached PDF instructions and installation videos. If the device is still not installed after a certain number of emails, trigger a survey that links participants to resources tailored to their specific issues.
Vehicle-specific installation videos: Create short, easy-to-follow videos for each supported vehicle. Add a QR code in the printed manual so users can scan and instantly watch the video on YouTube.
Instruction redesign and testing: Simplify the instruction manual to reduce confusion and lower the perceived effort. Test different versions to see which one drives better results.
Include all necessary tools: Make sure participants receive everything they need to complete the install—no extra trips to the hardware store.
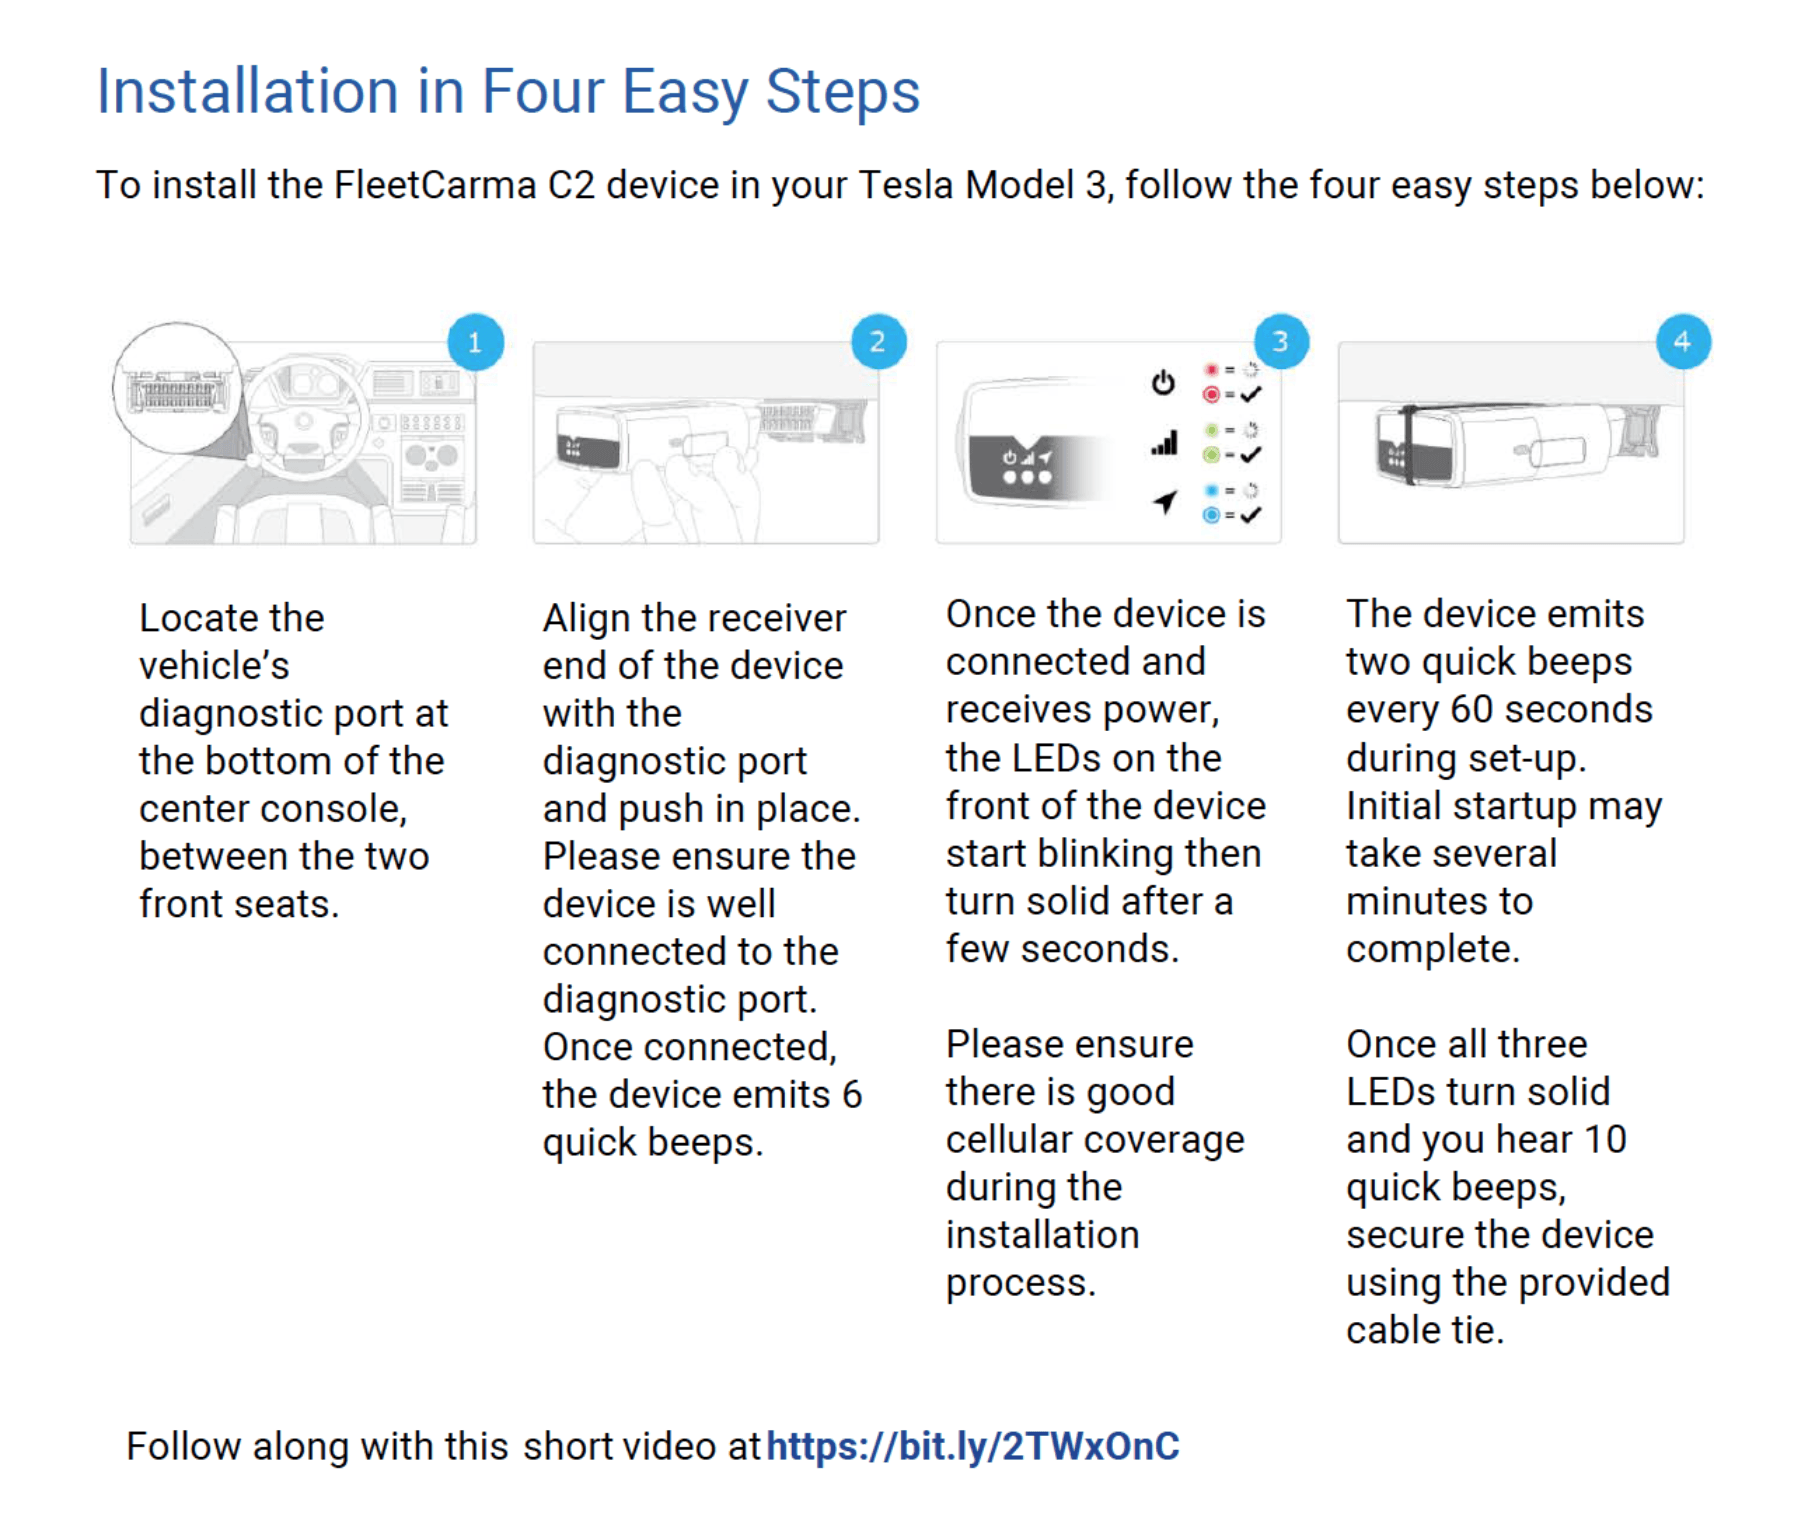
Below is a sample of the redesigned manual, which breaks things down into simple, easy-to-follow steps to help users take quick action.
The impact of the research and implementing the recommendations was significant. We achieved an average 12% increase in installation rates, taking us above our desired benckmark.